/ INDICATORS
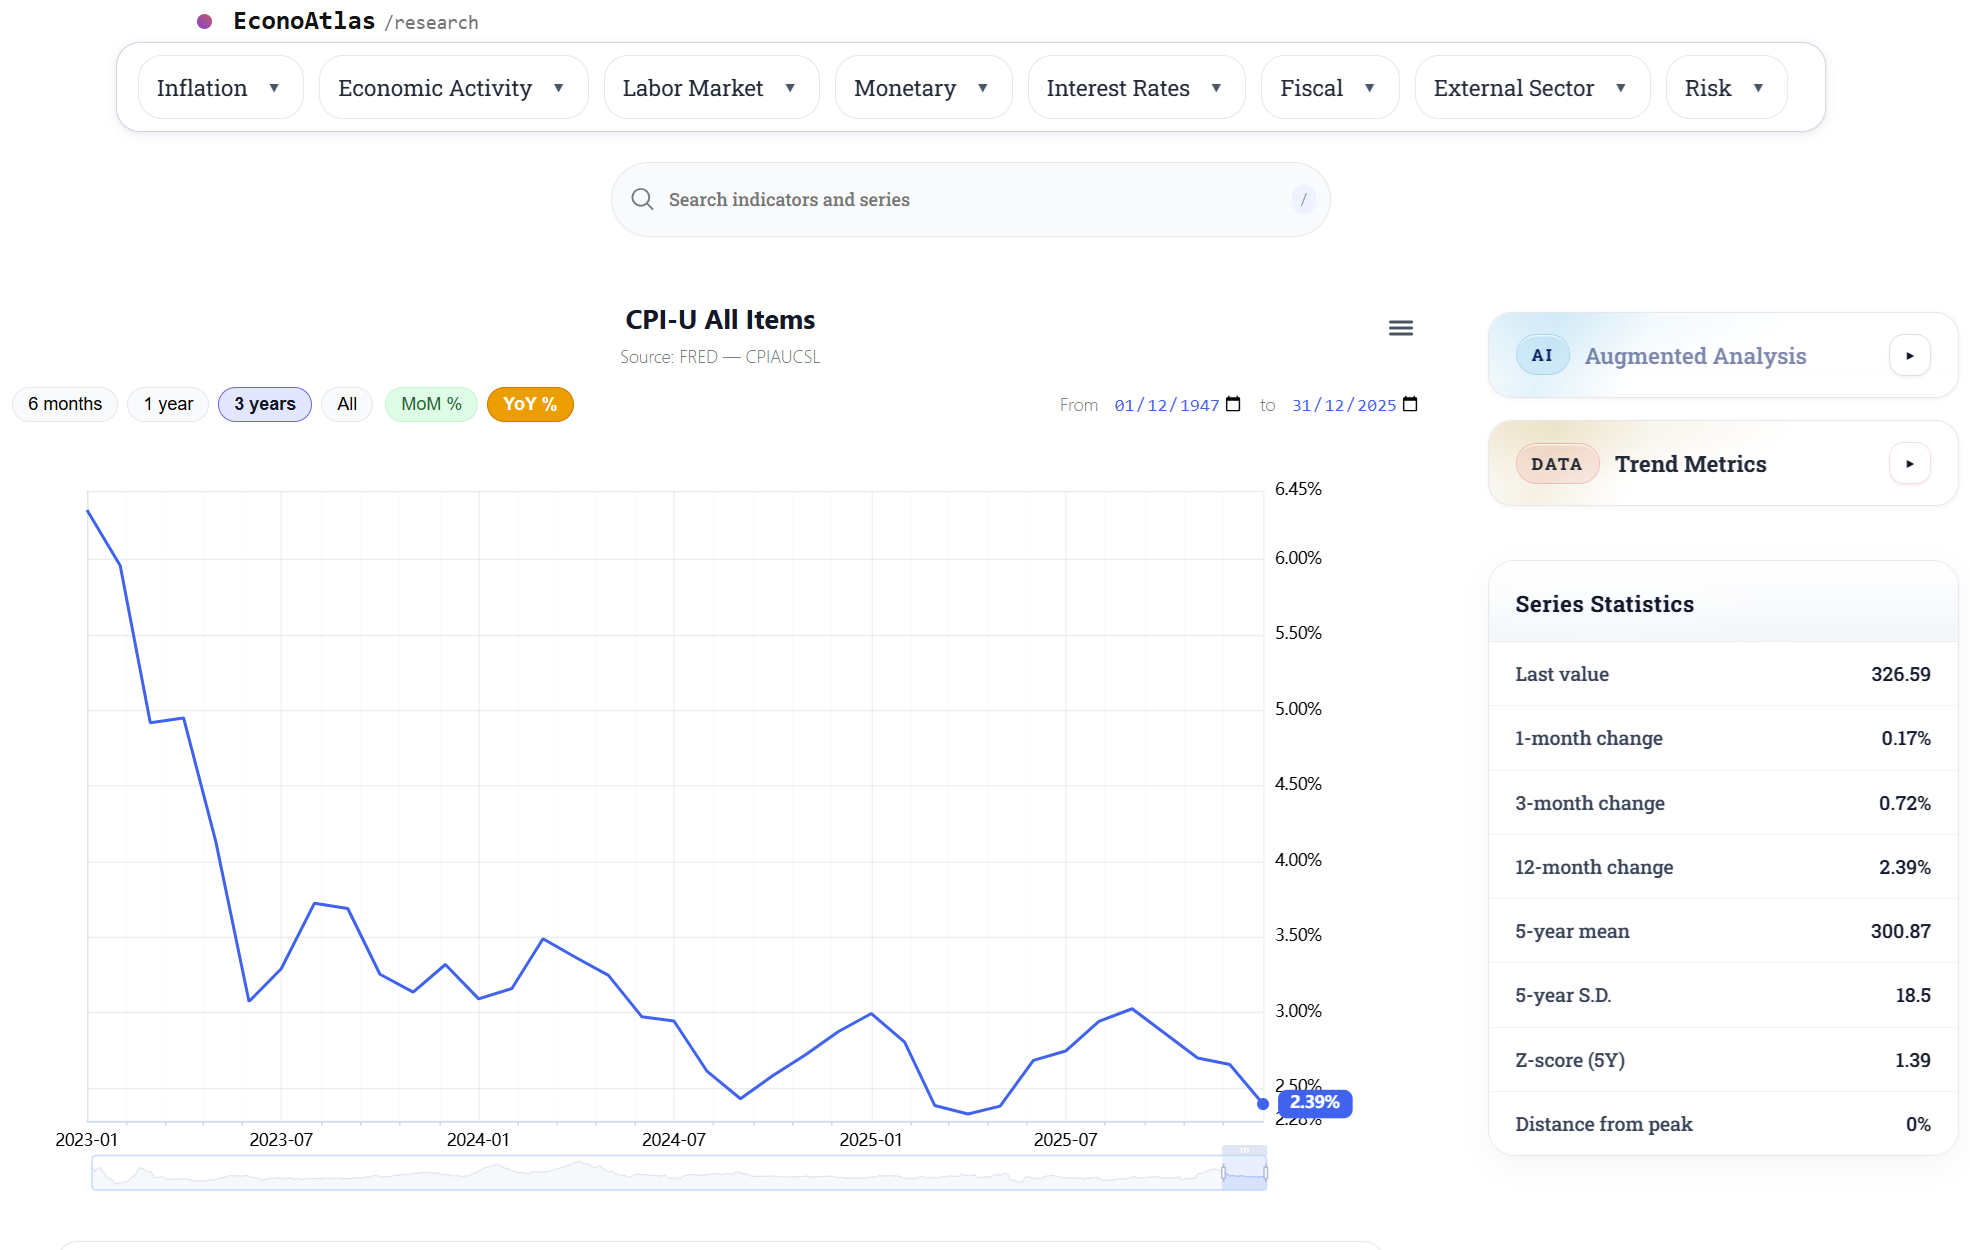
Indicator-level research, powered by AI analysis, trend metrics and statistics.
Each EconoAtlas indicator page combines interactive charts with an analytical sidebar — bringing together AI-augmented commentary, automated trend diagnostics and series statistics to help interpret the latest data in context.
- AI Generate structured macro commentary from the latest indicator movements, historical context and trend shifts.
- TRENDS Identify whether momentum is improving, deteriorating or stabilizing across key economic series.
- STATS Review last value, short-term changes, 12-month variation, historical averages, volatility and Z-score in one panel.
- WORKFLOW Move from chart observation to interpretation faster, with the key analytical layers placed directly beside the data.
/
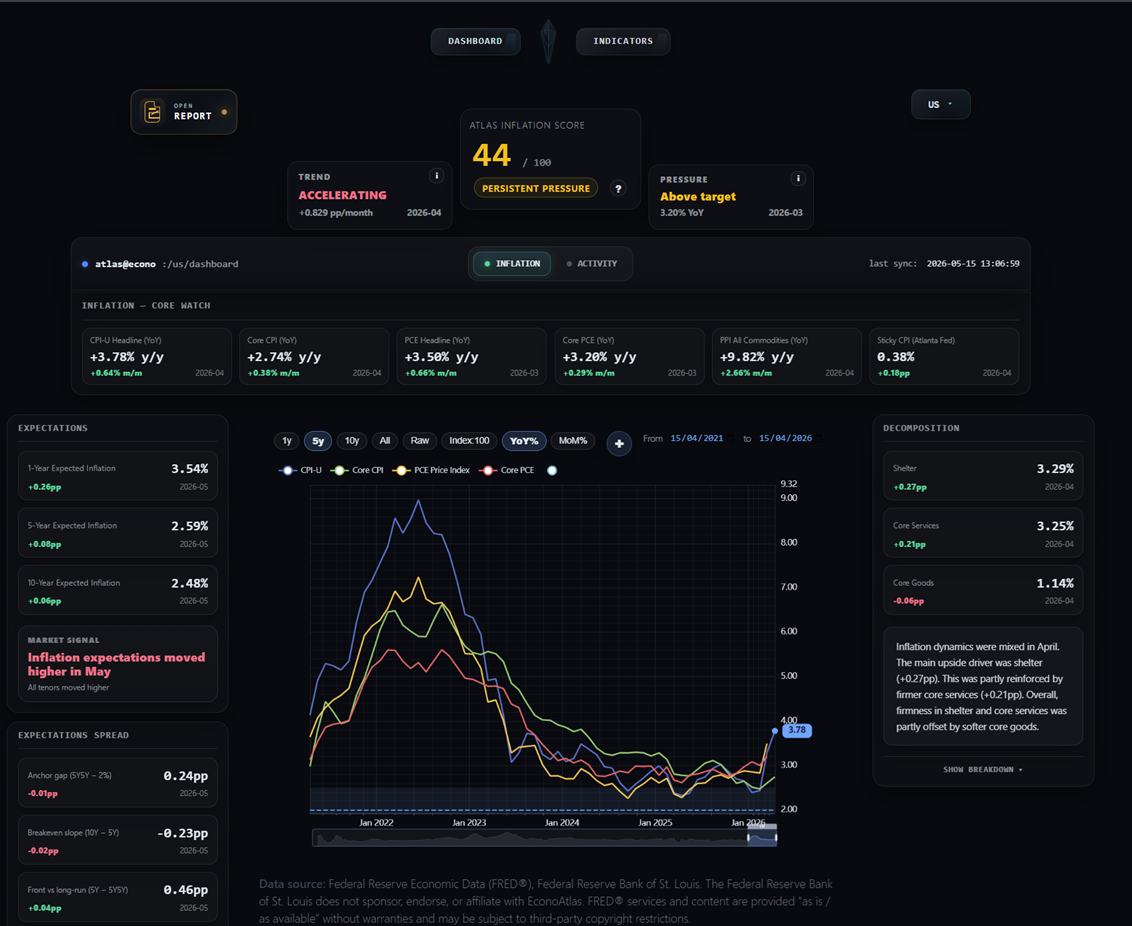
DASHBOARD
A structured macro workspace for monitoring data, signals and risk.
The EconoAtlas Dashboard brings together country-level macro indicators, watchlists, trend signals and automated research layers in a single analytical workspace.
- DASHBOARDS Monitor inflation, activity and macro conditions across countries through curated visual panels.
- WATCHLISTS Track priority indicators, latest values and relevant movements in one compact view.
- SIGNALS Detect improving or deteriorating macro trends using automated momentum and risk logic.
- AUTOMATED REPORTS Convert data movements into readable macro commentary, helping accelerate the research workflow.